PEC curves in
Precision PEC
New ME
December 2010
Precision PEC
New ME
December 2010
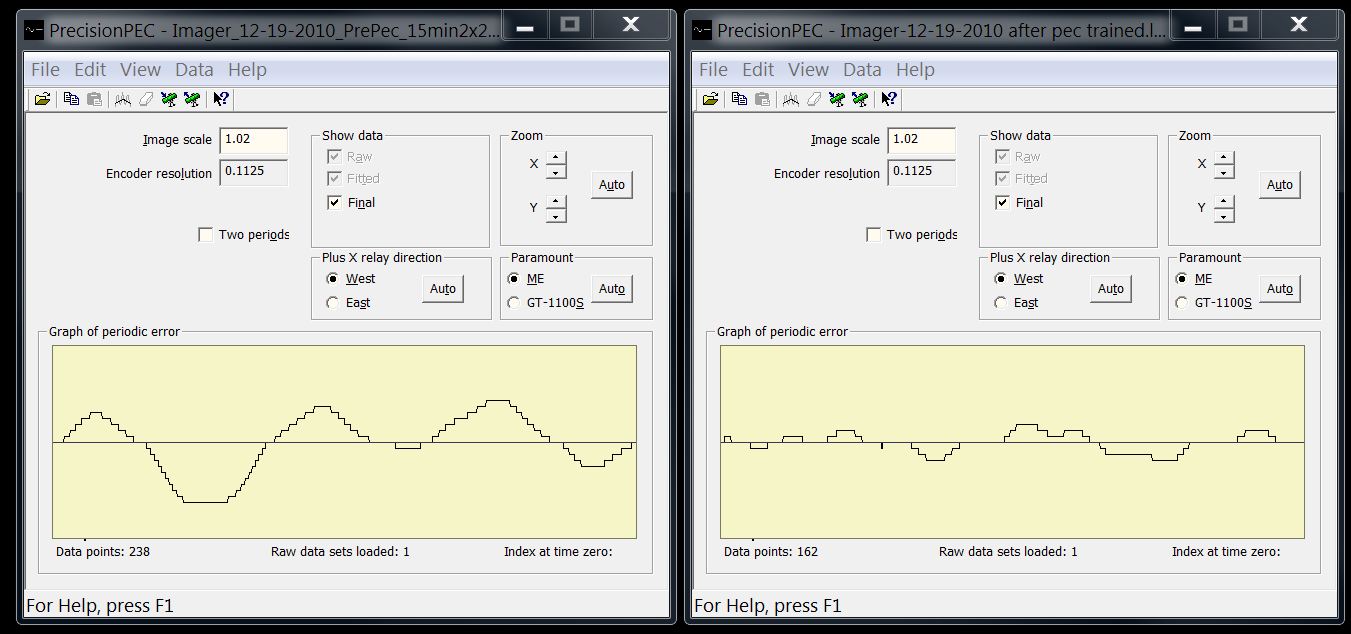
Above left is periodic error
curve generated by Precision
PEC, to be applied to the ME.
The curve indicates PE of
about 2 arc sec peak to peak.
curve generated by Precision
PEC, to be applied to the ME.
The curve indicates PE of
about 2 arc sec peak to peak.
Above right is periodic error curve
after PEC applied. It appears to be
mostly noise, approximately 0.8 arc
sec peak to peak.
after PEC applied. It appears to be
mostly noise, approximately 0.8 arc
sec peak to peak.